Data Reporting & Visualization
Our Data Reporting & Visualization services help you turn complex data into clear, actionable insights. With tailored reports and visualizations, we make it easy for you to understand and utilize your data effectively.

Custom Reporting Solutions
We create custom reports that align with your specific business goals and KPIs. By focusing on relevant metrics, we ensure that you receive the insights that matter most to your organization.

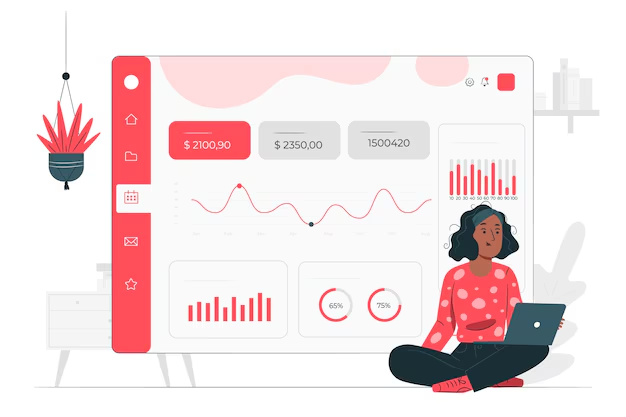
Dashboard Creation
Our team designs interactive dashboards that allow you to visualize key metrics and trends in real-time. These dashboards empower you to make data-driven decisions quickly and effectively.
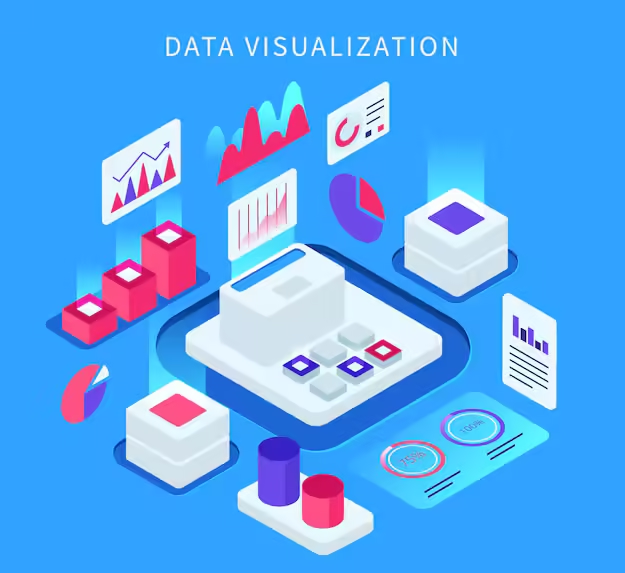
Data Visualization Techniques
We utilize various data visualization techniques to present your data in the most impactful way. By using charts, graphs, and infographics, we help you communicate insights clearly to stakeholders.
Automated Reporting Solutions
Our automated reporting solutions simplify the data reporting process, ensuring that you receive timely updates without manual effort. This allows you to focus on analyzing data rather than compiling it.
